
Restaurant Food Cost Formula: Is Your Menu Profitable? | Switzerland 2026

Quick Answer: Food cost percentage measures what share of your revenue goes to ingredients. The formula is: Food Cost % = Food Cost (CHF) divided by Revenue (CHF), multiplied by 100. To calculate your food cost for a period: Opening Inventory plus Purchases minus Closing Inventory equals Food Cost. Swiss restaurants should target a food cost of 27–30%, not the 28–35% cited in most guides, because Swiss labour costs consume 35–40% of revenue. Per dish, the formula is: Food Cost % per Dish equals Ingredient Cost divided by Menu Price, multiplied by 100. The gap between your target food cost percentage and your actual food cost percentage, expressed in CHF, is the most important number on your profit and loss account.
You can fill every table, every night, and still lose money if your menu is not profitable. The most common reason is not bad food and not bad service. It is a food cost percentage that nobody has calculated in two years, running five or six points above where it should be.
Food cost percentage is the diagnostic tool that tells you whether your menu is working financially. Every restaurant needs two versions of it: one for the whole operation and one for each dish individually.
What Is Food Cost Percentage and Why Does It Matter?
Food cost percentage is the proportion of your food revenue that goes towards buying ingredients. It is expressed as a percentage of sales, not as a CHF amount, because the percentage stays meaningful as your volume changes.
A restaurant doing CHF 15,000 per week in food sales with CHF 4,500 in ingredient costs runs a 30% food cost percentage. If that restaurant doubles its volume to CHF 30,000 per week, and ingredient costs also double to CHF 9,000, the food cost percentage stays at 30%. The percentage is a ratio; it benchmarks your efficiency.
Why it matters: every percentage point of food cost directly reduces your net profit by the same amount. A Swiss casual dining restaurant running at 34% food cost instead of 29% is losing 5% of every franc it earns to ingredients beyond its target. On CHF 600,000 in annual revenue, that 5% gap costs CHF 30,000 in profit each year.
That CHF 30,000 does not disappear in one dramatic moment. It leaks through inconsistent portioning, outdated supplier prices built into your recipe cards, untracked waste, and delivery orders priced the same as dine-in meals despite higher packaging costs.
The Two Food Cost Formulas Every Restaurant Needs
Formula 1: Restaurant-Wide Food Cost Percentage
This formula gives you a health check across the whole operation for a given period, typically a week or a month.
Step 1: Calculate your food cost in CHF
Food Cost (CHF) = Opening Inventory + Purchases During Period - Closing Inventory
Step 2: Calculate the percentage
Food Cost % = Food Cost (CHF) ÷ Food Revenue (CHF) × 100
Worked example (weekly, Zurich casual restaurant):
| | CHF |
|---|---|
| Opening inventory | 8,500 |
| Purchases during the week | 4,200 |
| Closing inventory | 6,800 |
| Food cost | 5,900 |
| Food revenue for the week | 19,500 |
| Food cost percentage | 30.3% |
This restaurant is within the Swiss target range of 27–30%. If the food cost had come out at 35%, that would signal a problem worth investigating immediately.
Track this calculation weekly, not monthly. Monthly tracking hides problems for too long. A food cost spike in week 2 that resolves by week 4 still represents CHF hundreds in unnecessary loss, and you will not see it in a monthly figure.
Formula 2: Food Cost Percentage Per Dish
The restaurant-wide calculation tells you whether you have a problem. The per-dish calculation tells you which dishes are causing it.
Food Cost % per Dish = Ingredient Cost per Portion ÷ Menu Price × 100
Every dish on your menu should have a recipe card listing all ingredients, quantities per portion, current purchase prices, and the resulting ingredient cost. Without recipe cards, you are estimating, and estimates compound into significant inaccuracies at scale.
Worked example (two dishes from the same pizza restaurant):
| Dish | Ingredient cost | Menu price | Food cost % |
|---|---|---|---|
| Margherita pizza | CHF 2.90 | CHF 18.50 | 15.7% |
| Prawn linguine | CHF 7.40 | CHF 22.00 | 33.6% |
The Margherita is performing well: a 15.7% food cost leaves significant margin to cover labour, overhead, and profit. The prawn linguine is running at 33.6%, which is at the upper limit for a casual restaurant. If Swiss food inflation has pushed prawn prices up since the menu was last priced, this dish may now be subsidising everyone who orders it.
For guidance on building those recipe cards and applying food cost to set your menu prices from scratch, see our complete guide on how to price a restaurant menu.
What Is the Right Food Cost Percentage for a Swiss Restaurant?
Most international guides quote 28–35% as the standard food cost range for restaurants. This benchmark comes primarily from US market data, where labour costs run 28–32% of revenue.
In Switzerland, labour costs for kitchen and service staff run 35–40% of revenue. That structural difference means Swiss restaurants need to target a lower food cost percentage to have any room left for overhead and profit.
| Restaurant Format | Swiss Target | Why |
|---|---|---|
| Quick service / kebab / pizza | 22–28% | Lower labour input per dish, high volume |
| Casual dining | 27–30% | Standard Swiss labour cost environment |
| Mid-range / full service | 28–32% | Higher ingredient quality accepted |
| Fine dining | 28–35% | Premium pricing absorbs higher ingredient costs |
| Beverages | 15–25% | Highest margin category on any menu |
A Swiss casual dining restaurant targeting 33% food cost is using a US benchmark in a Swiss cost structure. The result is a prime cost (food plus labour) above 70% of revenue, which leaves too little to cover rent, utilities, insurance, and produce a viable profit margin.
According to Gastro Suisse, Swiss food wholesale prices rose 11.4% between 2022 and 2025. A restaurant that set its food cost target in 2022 and has not reviewed it since is almost certainly operating with a gap between its target and its actual food cost.
The Four Food Cost Calculations That Give You Full Control
Most operators know their actual food cost percentage. The ones who run tight, consistent margins also know the other three.
1. Actual Food Cost Percentage
This is the formula above: what you actually spent on ingredients expressed as a percentage of revenue. It is your reality check.
2. Ideal Food Cost Percentage
Your ideal food cost is the target you set based on your cost structure, labour costs, overhead, and desired profit margin. For Swiss casual dining, a realistic ideal is 28–30%. This is not a guess; it is derived from the calculation: if labour runs at 37%, overhead at 16%, and you need 5% net profit, your food cost budget is 42% remaining, not all of which goes to food. Set your ideal intentionally, not from a generic benchmark.
3. Theoretical Food Cost Percentage
Theoretical food cost is the most precise version. It calculates exactly what your food cost should have been this week, based on your actual recipes and actual sales mix, using current ingredient prices.
Formula: Theoretical Food Cost = Sum of (Dishes Sold × Recipe Cost per Dish) ÷ Total Revenue × 100
This is more complex to calculate than the restaurant-wide formula, but it tells you exactly what you should have spent on food, given your specific sales mix. If you sold 80 Margherita pizzas and 45 prawn linguines, the theoretical food cost tells you precisely what those ingredients should have cost at your standard recipe and current prices.
4. Food Cost Variance
Variance is the gap between your theoretical food cost and your actual food cost, expressed as a percentage.
Variance = Actual Food Cost % - Theoretical Food Cost %
A variance of zero means your kitchen is executing recipes precisely, portions are correct, waste is minimal, and delivery reconciliation is working. A positive variance means you are spending more than you theoretically should.
CHF impact of food cost variance:
| Variance | Weekly revenue | Weekly loss | Annual loss |
|---|---|---|---|
| 2% variance | CHF 20,000 | CHF 400 | CHF 20,800 |
| 4% variance | CHF 20,000 | CHF 800 | CHF 41,600 |
| 6% variance | CHF 20,000 | CHF 1,200 | CHF 62,400 |
A 6% variance on CHF 20,000 weekly revenue loses CHF 62,400 per year. That is real money leaving through gaps in portion control, waste, supplier discrepancies, and theft. Our restaurant loss prevention guide covers the specific causes and controls for this kind of operational loss.
How to Run a Menu Profitability Audit Using Food Cost Data
Once you have per-dish food cost percentages for every item on your menu, you can conduct a menu profitability audit. This places each dish into one of four categories based on two variables: food cost percentage (low is better) and sales volume (high is better).
The four categories:
Stars: low food cost %, high sales volume. These are your best performers. They are popular and profitable. Feature them prominently in your physical and digital menu, invest in photos, and train staff to mention them. Protect these dishes from ingredient substitutions that might reduce quality.
Puzzles: low food cost %, low sales volume. These dishes make good margin but not enough guests order them. They need better placement on the menu, better descriptions, or a staff recommendation. A “Chef’s Pick” badge on your QR menu can move a Puzzle toward Star status within weeks.
Plowhorses: high food cost %, high sales volume. These are popular but eating your margin. Options: increase the menu price by CHF 2–4, adjust the portion size, substitute a component with a lower-cost alternative, or create a version with different accompaniments. Do not remove them from the menu without replacing them with something of similar appeal.
Dogs: high food cost %, low sales volume. Remove them. They complicate the kitchen, increase inventory requirements, and generate neither volume nor margin. Every dish removed from a menu simplifies operations and reduces waste.
Updating your recipe cards and food cost calculations before and after this audit gives you a before-and-after comparison. Even moving two Plowhorses to the Puzzle category through repricing, and converting two Puzzles to Stars through better placement, can improve your overall food cost percentage by 2–3 percentage points.
For the complete approach to positioning high-margin items on your digital and physical menu, see our restaurant menu pricing strategies guide.
Five Reasons Your Food Cost Is Running Higher Than It Should Be
If your actual food cost percentage is above your target, the cause is almost always one of these five:
1. Portion creep. Recipe cards specify 180g of protein. Kitchen staff serves 210g because it “looks better on the plate.” At CHF 42/kg, that 30g difference costs CHF 1.26 per plate. Across 60 plates per service, that is CHF 75 per day, CHF 27,375 per year from one dish alone. Standardise portions with scales at every station.
2. Outdated recipe costs. Swiss Federal Statistical Office data shows food wholesale prices rose 11.4% between 2022 and 2025. A recipe costed at CHF 6.50 in 2022 may cost CHF 7.24 today. If the menu price has not changed, the food cost percentage has risen 5–6 points without anyone noticing.
3. Untracked waste and spoilage. Ingredients that leave the kitchen as waste do not generate revenue but do generate food cost. Lettuce that wilts before service, over-prepared sauces that are discarded, broken eggs. All of these inflate your actual food cost without appearing on a plate. A daily waste log, costed at your recipe prices, makes the invisible visible.
4. Delivery packaging not included in recipe costs. A delivery order for CHF 35 in food incurs CHF 1.50–2.50 in packaging. If that packaging cost is not in your recipe card for the delivery version of each dish, your delivery food cost percentage is understated and your delivery profitability is worse than you think.
5. Supplier price increases absorbed silently. Suppliers send price lists. Invoices change. Without a system that flags when an ingredient cost has risen more than 5% versus your recipe card price, these increases pass through to your food cost unnoticed. Review supplier invoices against your recipe card prices at least monthly.
How SparissimoFood Helps You Track and Improve Food Cost
Food cost percentage is only as good as the data behind it. Two things improve accuracy: standardised recipe data and real-time sales data. SparissimoFood contributes to both.
Menu Builder and Recipe Integration. SparissimoFood’s menu management system lets you build and maintain a digital menu with structured item data. When you know exactly which dishes are selling, in what volumes, and through which channels, you have the sales-side input needed to calculate theoretical food cost accurately. A dish that sells well through your dine-in QR channel but poorly through delivery requires a different food cost management approach; the analytics make that visible.
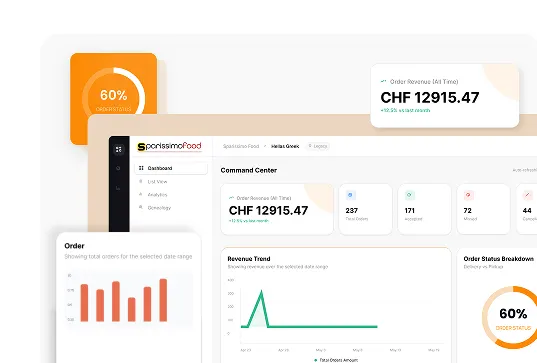
Analytics Dashboard. SparissimoFood’s manager dashboard shows order volumes by dish, by channel, and by time period. This is the sales data that completes your theoretical food cost calculation. Knowing that your prawn linguine sold 45 times this week allows you to calculate the exact theoretical ingredient cost for that dish and compare it against what you actually spent.
Direct Channel Economics. Every direct order placed through SparissimoFood instead of through a third-party platform recovers 17–22% in commission costs per order. That recovered margin directly expands the room you have to manage food costs. A restaurant running a tight 29% food cost that loses 27% to Just Eat commission on every delivery order has near-zero net margin from delivery. Shifting those orders to a direct channel at 5–8% commission changes the economics of each dish fundamentally.
SparissimoFood starts at CHF 49/month with a commission of 5–8% per order. Explore current plan options at manage.sparissimofood.com/plans.
Frequently Asked Questions
What is the food cost percentage formula for restaurants? There are two versions. For the whole restaurant over a period: Food Cost % = (Opening Inventory plus Purchases minus Closing Inventory) divided by Food Revenue, multiplied by 100. For an individual dish: Food Cost % per Dish = Ingredient Cost per Portion divided by Menu Price, multiplied by 100. Swiss restaurants should target a food cost percentage of 27–30%, not the generic 28–35% cited in US-focused resources, because Swiss labour costs are structurally higher.
What is a good food cost percentage for a restaurant in Switzerland? For casual dining in Switzerland, 27–30% is the target. For quick service and high-volume formats, 22–28% is achievable. Beverages typically run 15–25% and should be managed to the lower end of that range; beverage margin funds a large portion of the kitchen’s fixed costs. Fine dining may run 28–35% because higher menu prices absorb premium ingredients. The key Swiss adjustment: the generic 28–35% benchmark assumes labour at 30% of revenue. In Switzerland, labour is 35–40%, which compresses the food cost budget.
How do I calculate food cost per dish? List every ingredient in one portion of the dish with its exact quantity in grams or millilitres. Multiply each ingredient quantity by its current purchase price per kilogram or litre to get the cost for that ingredient in that portion. Apply any yield factor for ingredients that lose volume through preparation, cooking, or trimming. Sum all ingredient costs. That total is your food cost per portion in CHF. Divide it by the menu price and multiply by 100 to get the food cost percentage. For a complete worked example with yield factors and Swiss wholesale prices, see our guide on how to price a restaurant menu.
What is the difference between actual and theoretical food cost? Actual food cost is what you genuinely spent on ingredients during a period, calculated from inventory movements. Theoretical food cost is what you should have spent, calculated by multiplying each dish’s recipe cost by the number of times it was sold. The variance between the two reveals operational inefficiencies: portion inconsistency, waste, untracked theft, supplier price changes, and accounting errors. A variance above 3% warrants a systematic investigation.
How often should a restaurant calculate its food cost percentage? Weekly for the restaurant-wide calculation, which reveals problems quickly enough to act on them. Per-dish food costs should be recalculated whenever a significant ingredient changes in price, typically whenever a key ingredient rises more than 10–15%. A full menu profitability audit, placing every dish into the Stars, Plowhorses, Puzzles, or Dogs framework, should be done every six months, or immediately after any major change to the supplier price list.
A menu that looks profitable in the dining room but has never been costed dish by dish is a menu that is guessing with your margin.

.Ds4FHhSq_ZxC9WE.webp "Restaurant Upselling Techniques That Don't Feel Pushy")




.CXCr6fQt_Z11gsYh.webp "Build a Branded Restaurant App Without Developers")
.y09Xtv8Z_1gH6f6.webp "Set Up Restaurant Online Ordering in Under a Week")
.B-Rl4IDw_Z204OoN.webp "Restaurant Loss Prevention and Theft Guide")

.DPpk5JZR_AlrVy.webp "Restaurant Communication During Peak Hours | Guide 2026")


.B6eEizW1_Z2bHQYl.webp "Restaurant Menu Pricing Strategies That Actually Protect Your Margins in 2026")
.CRszlDy5_2neUXu.webp "How to Migrate from GloriaFood Without Disruption: A Technical Step-by-Step Guide")
.kT6N2QP-_1Tp2j1.webp "GloriaFood Is Shutting Down on April 30, 2027 — What Every Restaurant Owner Needs to Do Now")