
How to Read Your Restaurant Sales Data | Analytics Guide 2026


Quick Answer: Most restaurant owners check their total weekly revenue and stop there. That single number tells you whether you made money. It does not tell you why, which dishes are eroding your margin, which service period is underperforming, or which customers are not coming back. The seven metrics that give you a complete operational picture are: total revenue by channel, average order value by channel and daypart, food cost percentage, prime cost, table turnover rate, menu performance by margin and volume, and customer return rate. Reviewed together on a weekly basis, these seven numbers tell you what to change in your kitchen, your schedule, your menu, and your marketing before problems compound into losses.
Running a restaurant without reading your sales data is like driving at night without headlights. You can stay on the road by feel, and most of the time nothing goes wrong. But the moment something changes, a supplier price increase, a drop in Tuesday covers, a dish quietly dragging your food cost above target, you find out too late to correct it cheaply.
In Switzerland, where restaurant profit margins average between 3 and 9 percent according to Gastro Suisse research, and where Swiss food wholesale prices rose 11.4 percent between 2022 and 2025 according to the Swiss Federal Statistical Office, the gap between a restaurant that reads its data weekly and one that does not is often the gap between profitability and loss.
Why Most Restaurants Are Looking at the Wrong Numbers
The typical Swiss restaurant owner reviews total revenue. Some also review their total order count. A smaller number review their average order value. Very few review all seven of the metrics that actually determine their margin.
Total revenue tells you the size of your business. It does not tell you the health of it. A restaurant generating CHF 25,000 per week in revenue with a food cost of 35 percent and a prime cost of 72 percent is losing money at the same time as it is busy. The revenue number looks fine. The operational numbers are not.
The shift from looking at revenue to looking at margin drivers is the most important analytical transition a restaurant operator can make. It does not require a data team or a specialist software subscription. It requires knowing which seven numbers to check, where to find them, and what to do when they are outside their target range.
The 7 Metrics Every Swiss Restaurant Should Track Weekly
Metric 1: Total Revenue by Channel
Split your weekly revenue into its component channels: dine-in, direct online ordering, third-party delivery platforms such as Just Eat or Uber Eats, and pickup or takeaway. Track the percentage contribution of each channel, not just the absolute amounts.
Why the channel split matters: each channel has a fundamentally different cost structure. Dine-in revenue covers rent, service staff, and food cost. Direct online delivery covers food cost, packaging, and a platform commission of 5 to 8 percent. Third-party delivery covers the same costs plus a platform commission of 10 to 30 percent depending on whether you use your own drivers or the platform’s couriers.
A restaurant in which third-party delivery is growing as a share of total revenue is a restaurant in which margin is being compressed, even if absolute revenue is increasing. The channel mix is the signal. Total revenue alone is the noise.
Track the direction of change week over week. A shift of 5 percentage points from third-party delivery to direct ordering over a month represents a meaningful margin improvement. A shift in the opposite direction is a warning that requires a response.
Metric 2: Average Order Value by Channel and Daypart
Your average order value varies significantly by channel and by time of day. Dine-in orders at dinner are typically your highest average order values. Delivery orders on a Tuesday lunch are typically your lowest. Understanding where the gaps are tells you where the upselling opportunity is.
The formula is direct: Total Revenue divided by Number of Orders for each channel and time period.
A restaurant with a CHF 42 dine-in dinner AOV and a CHF 26 direct delivery AOV has a 62 percent gap between its two highest-priority channels. That gap is partly explained by the absence of drinks in delivery orders, by smaller portion selections, and by the absence of the upselling that happens naturally in a served dining environment. Each of these gaps is addressable through digital menu design, bundle offers, and minimum delivery thresholds.
Set a target AOV for each channel and daypart. Review it weekly. A dine-in AOV that drops by CHF 3 over two consecutive weeks is a signal to look at what changed: a menu item removed, a promotion that reduced spend, a shift in the time distribution of covers. For the full range of tactics to improve AOV across channels, see our guide to increasing restaurant average order value.
Metric 3: Food Cost Percentage
Food cost percentage is the share of your food revenue spent on ingredients. The formula is: Food Cost divided by Food Revenue, multiplied by 100.
For Swiss restaurants, the target range is 27 to 30 percent, which is lower than the 28 to 35 percent cited in most international guides. Swiss labour costs run at 35 to 40 percent of revenue, which means a food cost above 30 percent leaves insufficient room for overhead and profit.
Track this weekly by pulling your cost of goods from your invoices and your revenue from your ordering platform. A week-on-week increase of more than 2 percentage points from your baseline is a trigger to investigate: which dishes sold most this week, whether any ingredient costs changed, and whether portion sizes drifted upward.
Swiss food wholesale prices rose 11.4 percent between 2022 and 2025. A restaurant that last costed its recipes in 2023 may be running a food cost 4 to 6 percentage points above its intended target without realising it. For the full guide on how to calculate food cost per dish and identify where the variance is coming from, see our restaurant food cost formula guide.
Metric 4: Prime Cost
Prime cost is the sum of food cost and direct labour cost, expressed as a percentage of revenue. It is the most important single profitability metric in restaurant operations.
Formula: Prime Cost equals Food Cost plus Labour Cost, divided by Total Revenue, multiplied by 100.
For Swiss full-service restaurants, a sustainable prime cost target is 60 to 65 percent. Above 68 percent, most Swiss restaurants will not cover overhead costs and will operate at a loss. Below 58 percent, you may be understaffing or compromising on ingredient quality in ways that affect guest experience.
Prime cost responds faster to change than net profit does. An upward movement in prime cost in week two of a month, if addressed in week three, prevents a margin problem from appearing in the quarterly accounts. A prime cost spike that goes unnoticed until the accountant’s report six weeks later is much harder and more expensive to correct.
Track prime cost weekly. Identify separately whether the movement is driven by food cost or by labour cost, as the corrective action is different for each. For the broader financial context of how prime cost connects to your net margin, see our restaurant profitability guide.
Metric 5: Table Turnover Rate
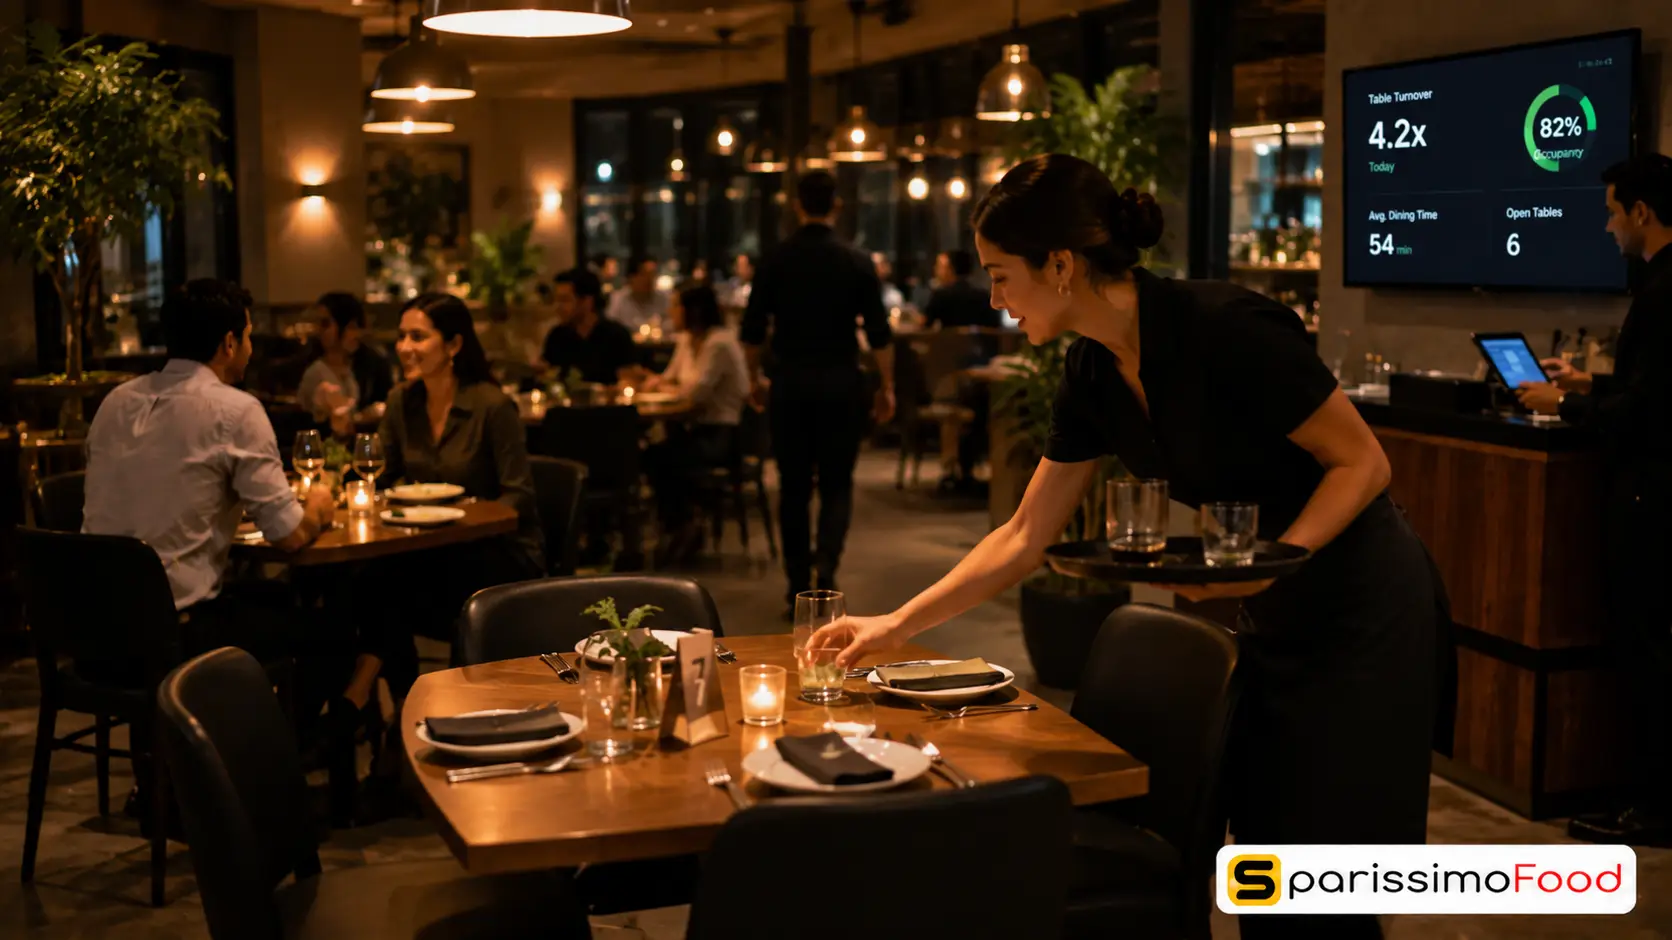
Table turnover rate is the number of times each table is occupied during a service period. For a 3-hour dinner service with 90-minute average occupancy, the expected turnover rate is 2.0. For a faster casual environment with 60-minute average occupancy, the rate is 3.0.
Formula: Number of Covers Served divided by Number of Available Seats equals Table Turnover Rate.
A table turnover rate below 1.5 during your busiest service period indicates a revenue capacity problem, not a demand problem. The kitchen and the room are available but not being used to their potential because tables are occupied longer than the revenue they generate justifies.
The primary levers for improving table turnover rate are QR-code dine-in ordering, which reduces the time from seating to first order; digital payment at the table, which eliminates the wait for the bill; and reservation management to reduce gaps between seatings. Each of these reduces table occupancy time without reducing the guest experience.
Track this metric by service period rather than as a daily average. A restaurant with a 2.4 lunch turnover and a 1.6 dinner turnover needs to look at why dinner occupancy is longer: is it the service flow, the menu pacing, the bill process?
Metric 6: Menu Performance by Margin and Volume
Every item on your menu can be placed into one of four categories based on two variables: how often it sells and how much margin it generates. Tracking this data monthly gives you a complete picture of which dishes are working and which are not.
High volume, high margin: these are your Stars. Protect them, feature them, invest in their presentation.
High margin, low volume: these are your Puzzles. The margin is there. The guest does not know to order them. Better placement, a photograph, or a staff recommendation can move a Puzzle to Star status within a month.
High volume, low margin: these are your Plowhorses. They are popular but eating your overall food cost percentage. Options include modest repricing, portion adjustment, or substituting a component.
Low volume, low margin: these are Dogs. Remove them. They complicate the kitchen, extend your supply list, and generate neither volume nor margin.
Review this analysis monthly rather than weekly. The data you need is item-level sales by dish, combined with your recipe cost per dish. Most ordering platforms provide item-level sales data. Your recipe costs come from your inventory and purchasing system.
Metric 7: Customer Return Rate
Customer return rate is the percentage of customers who place a second order within a defined period, typically 30 or 60 days.
Formula: Number of customers who ordered more than once in the period divided by Total number of customers who ordered in the period, multiplied by 100.
A return rate below 20 percent within 30 days indicates that a majority of your customers are one-time visitors rather than developing into regulars. This means your customer acquisition cost is being paid for every customer, every time, which is the most expensive possible revenue model.
A return rate above 35 percent indicates strong retention: a significant share of your customers are developing habitual ordering patterns. At 35 percent, roughly one in three customers who ordered last month is ordering again this month.
Track this metric only from your direct ordering channel, where you have named customer data. Third-party platforms do not provide customer-level return data. This is one of the most important commercial arguments for building a direct ordering base: without it, you cannot measure, and therefore cannot improve, the most value-determinant metric in your customer portfolio.
How to Read Your Data Without a Finance Background
The goal of reviewing these seven metrics weekly is not to produce a management report. It is to identify one or two things to change this week.
Structure your review as a 20-minute exercise at the same time each week, ideally Monday morning before service planning. Ask three questions about each metric:
Is it within its target range? If yes, move on. If no, ask the next question.
Has it moved in the same direction for two consecutive weeks? A single week outside the target range may be noise. Two consecutive weeks in the same direction is a trend.
What changed operationally during those weeks that could explain the movement? A new dish, a supplier change, a staffing adjustment, a promotion, a shift in your order channel mix. The data identifies the problem. The operational context explains the cause.
The corrective action follows from the cause. A food cost percentage that rose because a key protein increased in supplier price requires either repricing the affected dishes or finding an alternative source. A prime cost increase driven by labour requires reviewing the staffing schedule against actual order volumes for the period. A declining return rate requires examining the post-visit sequence and whether guests who placed a first order received a follow-up within 48 hours.
Using Data to Plan Ahead: Predictive Patterns in Swiss Restaurant Sales
Sales data is not only useful for diagnosing what happened. It is useful for planning what to prepare for.
Most Swiss restaurants show predictable weekly patterns in their sales data. Friday and Saturday dinner generate your highest-volume and highest-AOV periods. Tuesday and Wednesday lunch are your lowest-volume periods. These patterns are knowable from four to six weeks of consistent data.
Once known, they enable concrete operational decisions. Staff your highest-volume services exactly to the order volume data rather than to habit. Reduce your standing inventory order for slow periods where waste typically occurs. Schedule your highest-margin specials on the days when AOV is historically highest, because guests in a dinner mindset spend more than guests in a lunch mindset.
Seasonal patterns emerge over three to six months of data. A restaurant that tracks December cover counts, AOV, and channel mix for two consecutive years can predict its December third year with meaningful accuracy and plan purchasing, staffing, and promotions accordingly.
The difference between a restaurant that plans from data and one that plans from experience alone is not intelligence. It is having the data and the discipline to look at it on schedule.
How SparissimoFood’s Dashboard Delivers These Metrics
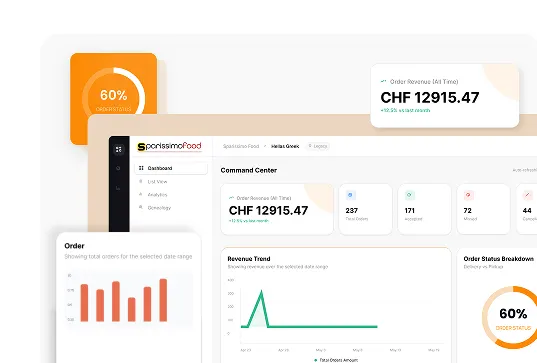
SparissimoFood’s manager dashboard provides six of the seven metrics in this guide directly, without requiring a separate analytics tool or manual calculation.
Revenue by channel. The dashboard shows order volume and revenue split by dine-in QR ordering, direct delivery, direct pickup, and any other channel connected to the platform. The channel breakdown updates in real time and can be filtered by day, week, or service period.
Average order value. AOV is visible by channel and can be tracked over time to identify trends. The dashboard shows both the current period AOV and its movement relative to the previous equivalent period.
Order-level data for food cost calculations. The platform’s item-level sales data, showing which dishes sold in what quantities, provides the sales-side input needed for your theoretical food cost calculation. Combine it with your recipe costs and you have your weekly theoretical food cost percentage without manual aggregation.
Menu performance by volume. Item-level sales reports identify your highest and lowest volume dishes for any period. Combined with your recipe cost data, this completes the Stars, Plowhorses, Puzzles, Dogs analysis monthly.
Customer return data. SparissimoFood captures contact data from every direct order. Because orders are linked to named customers, the platform shows which customers have placed more than one order and when. This is the data needed to calculate your 30-day return rate from your direct ordering base.
Kitchen throttling as an operational data response. When the real-time order dashboard shows incoming volume approaching your kitchen’s capacity, SparissimoFood allows your team to extend delivery windows or pause new incoming orders with a single action. This is data being used in real time to protect both kitchen performance and food quality, rather than being reviewed after the fact.
SparissimoFood starts at CHF 49 per month with an 8 percent commission on the Starter plan, and CHF 79 per month with a 5 percent commission on the Business plan. Explore the current plan options at manage.sparissimofood.com/plans.
Frequently Asked Questions
What sales data should a restaurant track every week? The seven most important weekly metrics are total revenue by channel, average order value by channel and daypart, food cost percentage, prime cost, table turnover rate, menu performance by margin and volume, and customer return rate. Of these, prime cost is the single most important. It combines food cost and labour cost as a percentage of revenue and is the earliest indicator of a margin problem. Track it weekly and investigate any movement of more than 2 percentage points above your target.
What is a good food cost percentage for a Swiss restaurant? Swiss restaurants should target a food cost of 27 to 30 percent of food revenue. This is lower than the 28 to 35 percent target cited in most international restaurant guides because Swiss labour costs run at 35 to 40 percent of revenue, which is significantly higher than most other markets. A Swiss restaurant running food cost at 33 percent alongside labour at 37 percent has a prime cost of 70 percent, which is above the sustainable threshold and will result in a loss after overhead is accounted for.
How do I read restaurant sales data without financial expertise? Structure your weekly review as a comparison against your own targets, not against external benchmarks. Establish a target range for each of the seven metrics based on your restaurant’s cost structure. Each week, identify which metrics are outside their target range and whether they have moved in the same direction for two consecutive weeks. A two-week trend in the wrong direction is a trigger to investigate the operational cause. A single-week deviation is typically not.
What is restaurant predictive analytics and does it apply to small restaurants? Predictive analytics uses historical data patterns to anticipate future performance. For independent Swiss restaurants, the practical application is straightforward: after four to six weeks of tracking sales data by day and service period, you can identify your predictable high-volume and low-volume periods and plan staffing, inventory, and promotions accordingly. The more data you collect, the more reliable your patterns become. Seasonal patterns typically emerge after two complete annual cycles. No specialised software is required at this scale: a consistent weekly review of your ordering platform data and a simple tracking spreadsheet are sufficient.
Why is tracking revenue by channel more useful than tracking total revenue? Total revenue tells you the size of your business. Revenue by channel tells you the health of your margin structure. Each channel carries a different cost: dine-in covers service staff and occupancy costs, direct delivery covers a 5 to 8 percent platform commission, and third-party delivery covers a 10 to 30 percent commission depending on the delivery model. A restaurant growing its third-party delivery revenue while its direct channel stays flat is growing its revenue at the expense of its margin. The channel split reveals this; the total does not.
Data does not run your restaurant. But a restaurant that ignores its data is asking every operational decision to be right by luck rather than by design.

.Ds4FHhSq_ZxC9WE.webp "Restaurant Upselling Techniques That Don't Feel Pushy")




.CXCr6fQt_Z11gsYh.webp "Build a Branded Restaurant App Without Developers")
.y09Xtv8Z_1gH6f6.webp "Set Up Restaurant Online Ordering in Under a Week")
.B-Rl4IDw_Z204OoN.webp "Restaurant Loss Prevention and Theft Guide")


.DPpk5JZR_AlrVy.webp "Restaurant Communication During Peak Hours | Guide 2026")


.B6eEizW1_Z2bHQYl.webp "Restaurant Menu Pricing Strategies That Actually Protect Your Margins in 2026")
.CRszlDy5_2neUXu.webp "How to Migrate from GloriaFood Without Disruption: A Technical Step-by-Step Guide")
.kT6N2QP-_1Tp2j1.webp "GloriaFood Is Shutting Down on April 30, 2027 — What Every Restaurant Owner Needs to Do Now")