
Menu Engineering: Arrange Your Restaurant Menu to Boost Sales
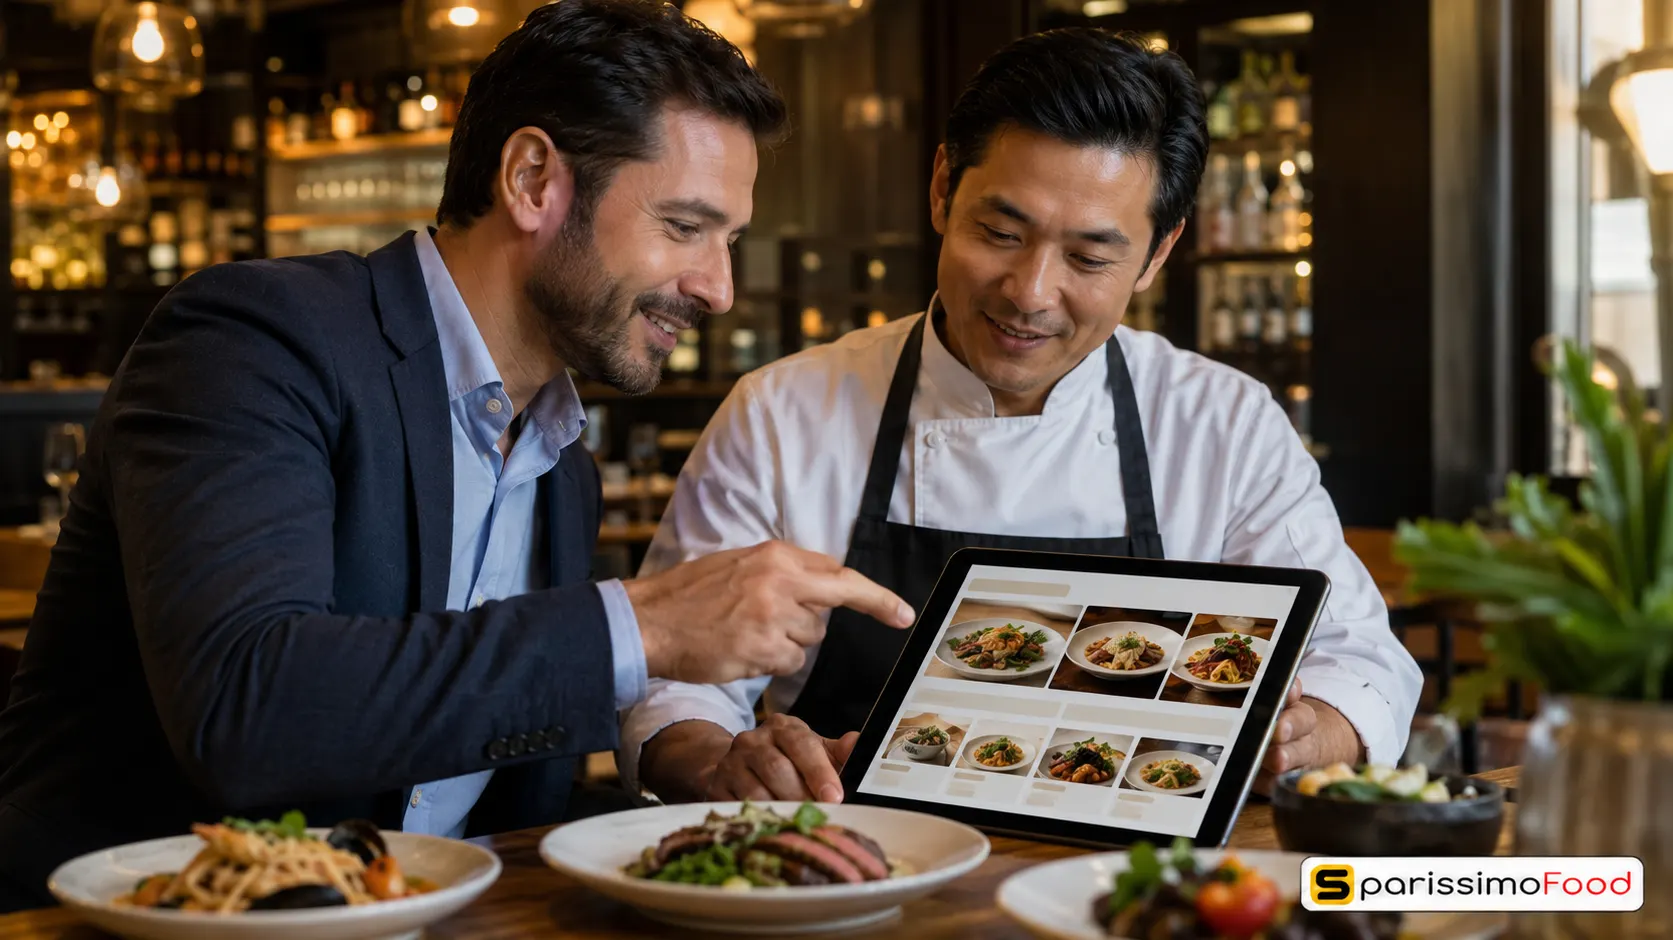

Quick Answer: Menu engineering is the practice of using sales data and food cost analysis to strategically position, describe, and price every item on your menu so that guests order the dishes that are most profitable for your restaurant. The four-quadrant framework sorts every dish into one of four categories: Stars with high sales and high margin, Plowhorses with high sales but low margin, Puzzles with high margin but low sales, and Dogs with low sales and low margin. Applied to a digital or QR menu, menu engineering means placing Stars in the highest-visibility positions, giving Puzzles better descriptions and photographs, repricing or adjusting Plowhorses, and removing Dogs. Research consistently shows that a well-engineered menu lifts average order value by 8 to 15% within 90 days, without any change to the food itself or its price.
71% of restaurant guests make their ordering decisions based on menu design and placement, according to research published in the Cornell Hospitality Quarterly. That figure means the sequence, position, description, and visual treatment of your menu items are shaping purchasing decisions before a single conversation between your team and your guest takes place.
This discipline takes that influence and makes it intentional. It is one of the highest-return investments a Swiss restaurant can make because it requires no additional food cost, no additional staff, and no price increase. It works by directing guests toward the dishes you most want them to order.
What Is Menu Engineering and Why It Matters for Swiss Restaurants
This practice was developed as an academic and operational framework in the early 1980s by Cornell University hospitality researchers Michael Kasavana and Donald Smith. Their core insight was that not all menu items contribute equally to a restaurant’s profit, and that the way a menu is structured can systematically shift guest ordering patterns toward higher-margin items.
The process involves analysing each menu item by its contribution margin and its sales volume, then restructuring the menu to increase the share of orders going to items with the strongest commercial performance.
This matters for Swiss restaurants in 2026 for two reasons beyond the general commercial logic.
First, Swiss food wholesale prices rose 11.4% between 2022 and 2025, according to the Swiss Federal Statistical Office. Many restaurants have absorbed that cost without repricing. Menu engineering allows you to recover margin through smarter item placement rather than visible price increases, which reduces guest friction.
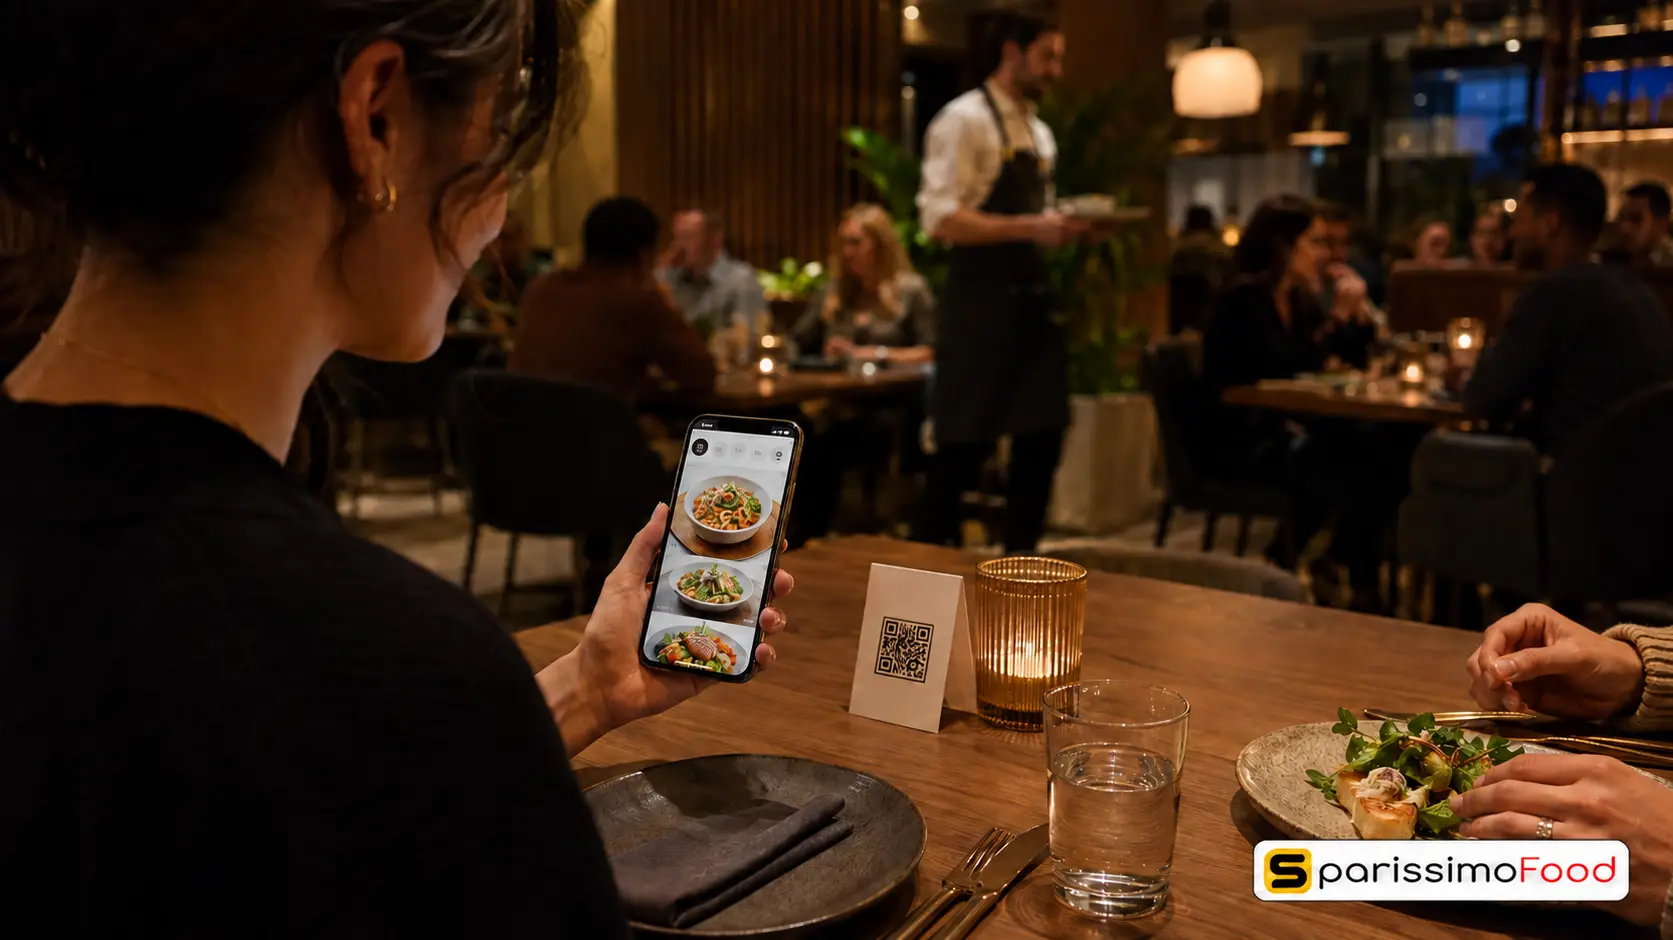
Second, the shift to digital and QR ordering in Switzerland has changed how this approach operates. A printed menu has physical constraints. A digital menu has none. Item position, photograph display, category order, and description length can all be adjusted instantly and tested against real order data. Menu engineering on a digital platform is a weekly practice, not a quarterly reprint project.
The Menu Engineering Matrix: Stars, Plowhorses, Puzzles, and Dogs
The foundation of this analysis is the four-quadrant matrix. Every item on your menu falls into one of four categories based on two variables: its contribution margin and its sales volume.
Stars: high contribution margin, high sales volume. Stars are your best-performing dishes both commercially and operationally. They sell frequently and generate strong margin on each sale. Your goal with Stars is to protect them, feature them prominently, invest in their photography, and ensure your descriptions make them the default choice in their category. Never remove a Star from the menu without strong evidence of a structural reason.
Plowhorses: high sales volume, low contribution margin. Plowhorses are your most popular dishes but they are eating your food cost. They sell well because guests want them, but each sale generates less margin than you need. Options include a modest price increase, a portion adjustment that reduces food cost while preserving the guest experience, or substituting one component with a lower-cost alternative. Do not remove a Plowhorse without a replacement of similar popularity.
Puzzles: high contribution margin, low sales volume. Puzzles have the margin you want but guests are not ordering them often enough. The problem is almost always visibility, description, or placement rather than the dish itself. Move a Puzzle to a higher-attention position, add a photograph, improve the description with sensory language, or have your team recommend it verbally. A Puzzle that converts to a Star through positioning changes is among the highest-value outcomes of a quarterly menu review.
Dogs: low contribution margin, low sales volume. Dogs generate neither profit nor volume. They complicate the kitchen, extend your ingredient list, and consume space that could feature a better-performing item. Remove them. If a Dog represents something a specific regular customer values, consider keeping it as an off-menu item available on request rather than a listed option.
Six Steps to Optimise Your Online Menu for Higher Sales
Step 1: Run the Four-Quadrant Analysis
Before changing anything on your menu, collect the data that will tell you where each item sits in the matrix. You need two numbers per dish: contribution margin and sales volume.
Contribution margin per dish equals the menu price minus the food cost. For a pizza with a CHF 22 menu price and CHF 5.50 food cost, the contribution margin is CHF 16.50. For a pasta with a CHF 19 menu price and CHF 6.20 food cost, the contribution margin is CHF 12.80.
Sales volume comes from your ordering platform data: how many times was each dish ordered in the review period.
For a Swiss casual restaurant reviewing a month of data, plot each dish on a two-axis chart: contribution margin on the vertical axis, sales volume on the horizontal axis. The midpoints divide the chart into four quadrants. Items above the midpoint on both axes are Stars. Items above on margin but below on volume are Puzzles. Items above on volume but below on margin are Plowhorses. Items below on both are Dogs.
For the complete guide to calculating contribution margin and food cost per dish, see our restaurant food cost formula guide.
Step 2: Apply the Golden Triangle to Your Digital Menu
The Golden Triangle is a menu design principle derived from eye-tracking research showing where guests look first when they open a menu. On a printed menu, the eye typically moves to the top right, then the top left, then the centre. On a digital mobile menu, the pattern shifts: the eye moves to the top of the first visible section, then to any item with a photograph.
For your digital menu, the practical application of this is:
Place your highest-contribution-margin Star in the first position of your most-viewed category. On a QR ordering interface, most guests scroll from top to bottom. The first item in each category receives the most attention. If your most profitable dish is buried in position six of a ten-item list, it is receiving a fraction of the visibility it deserves.
If your platform supports a featured or highlighted item section at the top of the menu, place your top two Stars there. This section is the digital equivalent of the Golden Triangle and will see disproportionate order volume relative to any other position.
Step 3: Optimise Category Size
Research from Cornell University and independently validated by Intermenu’s 2026 digital menu analysis found that 5 to 7 items per category is the optimal range for conversion. Categories with more than 9 items produce decision fatigue, which causes guests to default to familiar choices or to reduce their order rather than explore.
For each category on your digital menu, aim for 5 to 7 items. Remove Dogs first, as they consume a slot that could host a better-performing item. If removing a Dog takes a category below 5 items, consider whether to merge it with an adjacent category or add a new item.
A focused menu with fewer items per category also benefits your kitchen. A kitchen that executes 35 dishes consistently outperforms one executing 55 dishes inconsistently, both on quality and on food cost control.
Step 4: Add Strategic Photographs
Digital menu research from 2026 consistently shows that item photographs increase conversion rates for those items by 25 to 30%. This is not an aesthetic preference. It is a measurable commercial outcome.
The practical rule for Swiss restaurants: photograph your Stars first, then your Puzzles. Stars with photographs will generate even more orders, strengthening the revenue contribution of your best-performing items. Puzzles with photographs solve the primary problem of low visibility that is keeping high-margin items from performing.
One photograph rule: every photograph should be honest. A photograph that shows a beautifully styled version of a dish that looks materially different from what is served creates a guest experience gap that drives negative reviews. Take your photographs with the actual plated dish, in natural light if possible, and ensure the portion size shown matches what the guest receives.
Step 5: Write Engineered Item Descriptions
Description length and content are variables in menu strategy, not just in copywriting. A Star item should have a description that reinforces why it is worth ordering: specific ingredients, preparation method, and origin detail. A Puzzle item should have a description rewritten from scratch if it is currently underperforming, because the description is likely the factor suppressing orders.
For more on how to write menu item descriptions that increase sales, see our restaurant menu descriptions guide.
Step 6: Apply Price Anchoring to Your Category Structure
Price anchoring is a technique from behavioural economics applied to menu structure. When a guest sees a CHF 32 item next to a CHF 24 item in the same category, the CHF 32 item makes the CHF 24 item feel accessible. The CHF 24 item gets more orders, and it gets them with less margin resistance than if it appeared next to a CHF 19 item.
Place your highest-priced item first or second in any category where you want the next-most-expensive item to appear reasonably priced. The anchor changes the reference point for every item below it.
Digital and QR Menu Optimisation: What Changes Online
The 2026 evolution of this practice is specifically enabled by digital ordering data. A printed menu can tell you what sold. A digital menu can tell you what was viewed, how long a guest spent on each item, which categories were skipped, and what the view-to-order ratio is for every dish.
This data makes the four-quadrant matrix more precise. Instead of assuming a Puzzle is low in sales because it is a niche item, you can see that it has a 45% view rate but only a 6% order rate. That gap tells you the description or the photograph, not the dish itself, is the barrier.
For Swiss restaurants using QR table ordering, the analytics available from your ordering platform should be reviewed weekly as part of a standard menu performance check. The review takes approximately 10 to 15 minutes and produces clear actions: which item to move up, which description to rewrite, which photograph to add.
Track your average order value by category and by day of week. A drop in average order value for a specific category that correlates with a recent menu change indicates the change worked against you. Reverse it and test an alternative. For the full framework on tracking and improving what each customer spends per visit, see our guide to increasing restaurant average order value.
How to Measure Whether Your Menu Changes Are Working
Three metrics tell you whether your menu changes are producing results.
Average order value by category. If the category where you repositioned a Puzzle shows a 10% increase in average order value in the two weeks after the change, the repositioning worked. If it shows no movement, the problem may be the description rather than the position.
Order share by item. If a Star previously held 18% of orders in its category and now holds 24% after photograph addition, the photograph is working. If a Dog still holds 5% of orders two months after its description was improved and photograph added, remove it.
Revenue per menu view. On a digital platform, this is the total revenue generated divided by the total number of menu views in a period. A rising revenue per view indicates the menu as a whole is converting better. A flat revenue per view alongside rising overall revenue typically indicates volume growth rather than menu efficiency improvement.
Run a full menu performance review monthly for the first three months after implementing changes. After that, a quarterly review is typically sufficient unless you are running seasonal menu rotations that require more frequent analysis.
How SparissimoFood Supports Your Menu Strategy
This approach requires two things to work: the ability to change your menu quickly and accurately, and the data to know whether changes are producing results. SparissimoFood provides both within a single platform.
Instant menu updates across all channels. SparissimoFood’s menu builder lets you move items between positions, add photographs, rewrite descriptions, and adjust prices in real time. A change made in the dashboard appears immediately on your QR table ordering system, your direct delivery menu, and your direct ordering website simultaneously. There is no reprint delay, no version mismatch between channels, and no manual update required on a separate system.
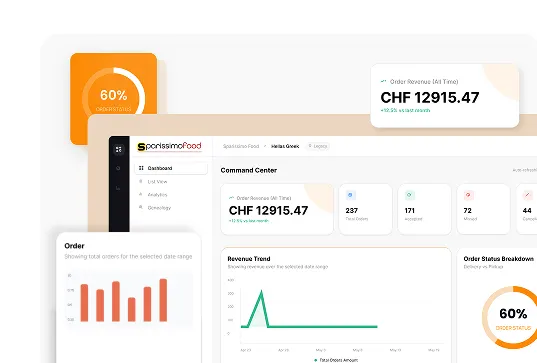
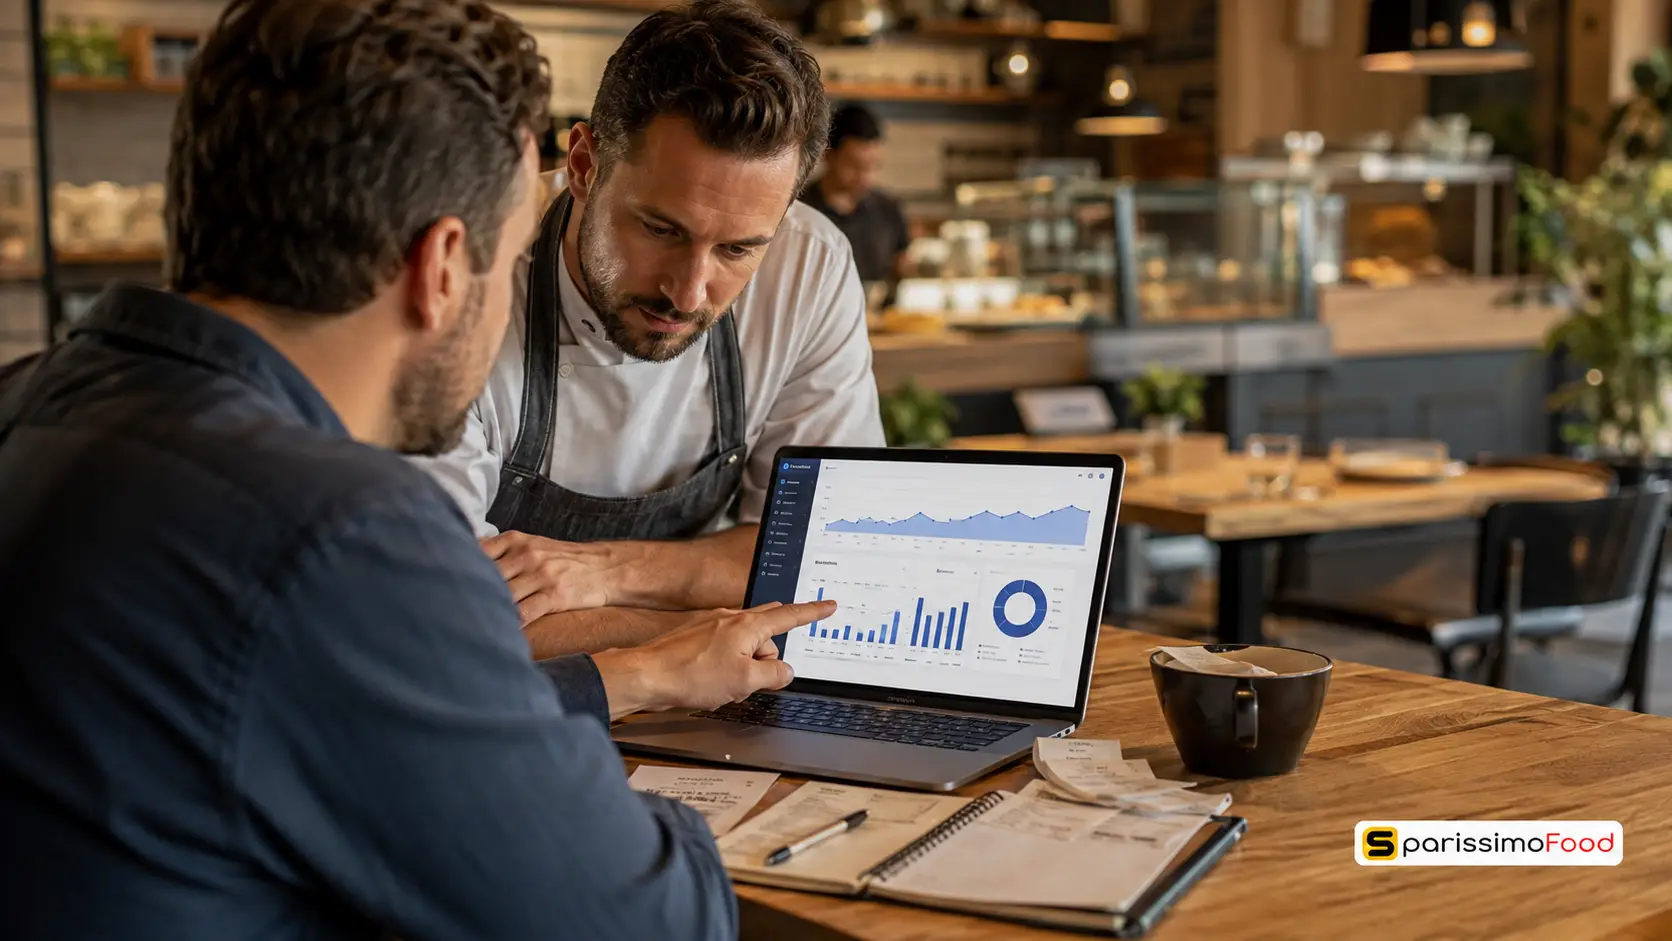
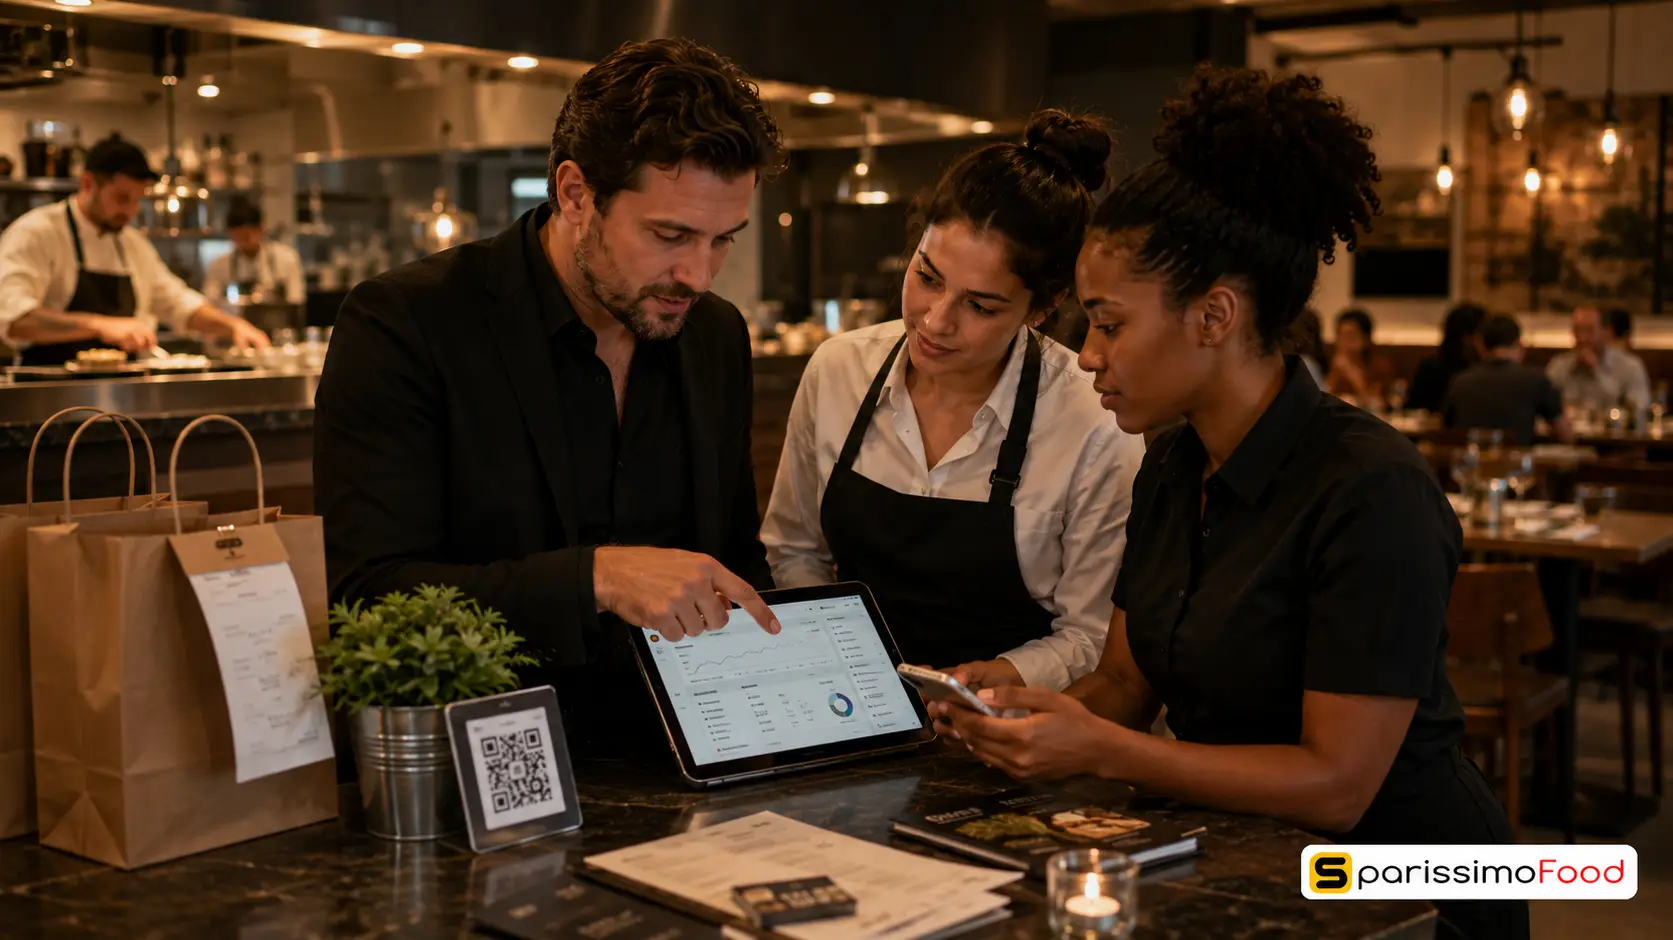
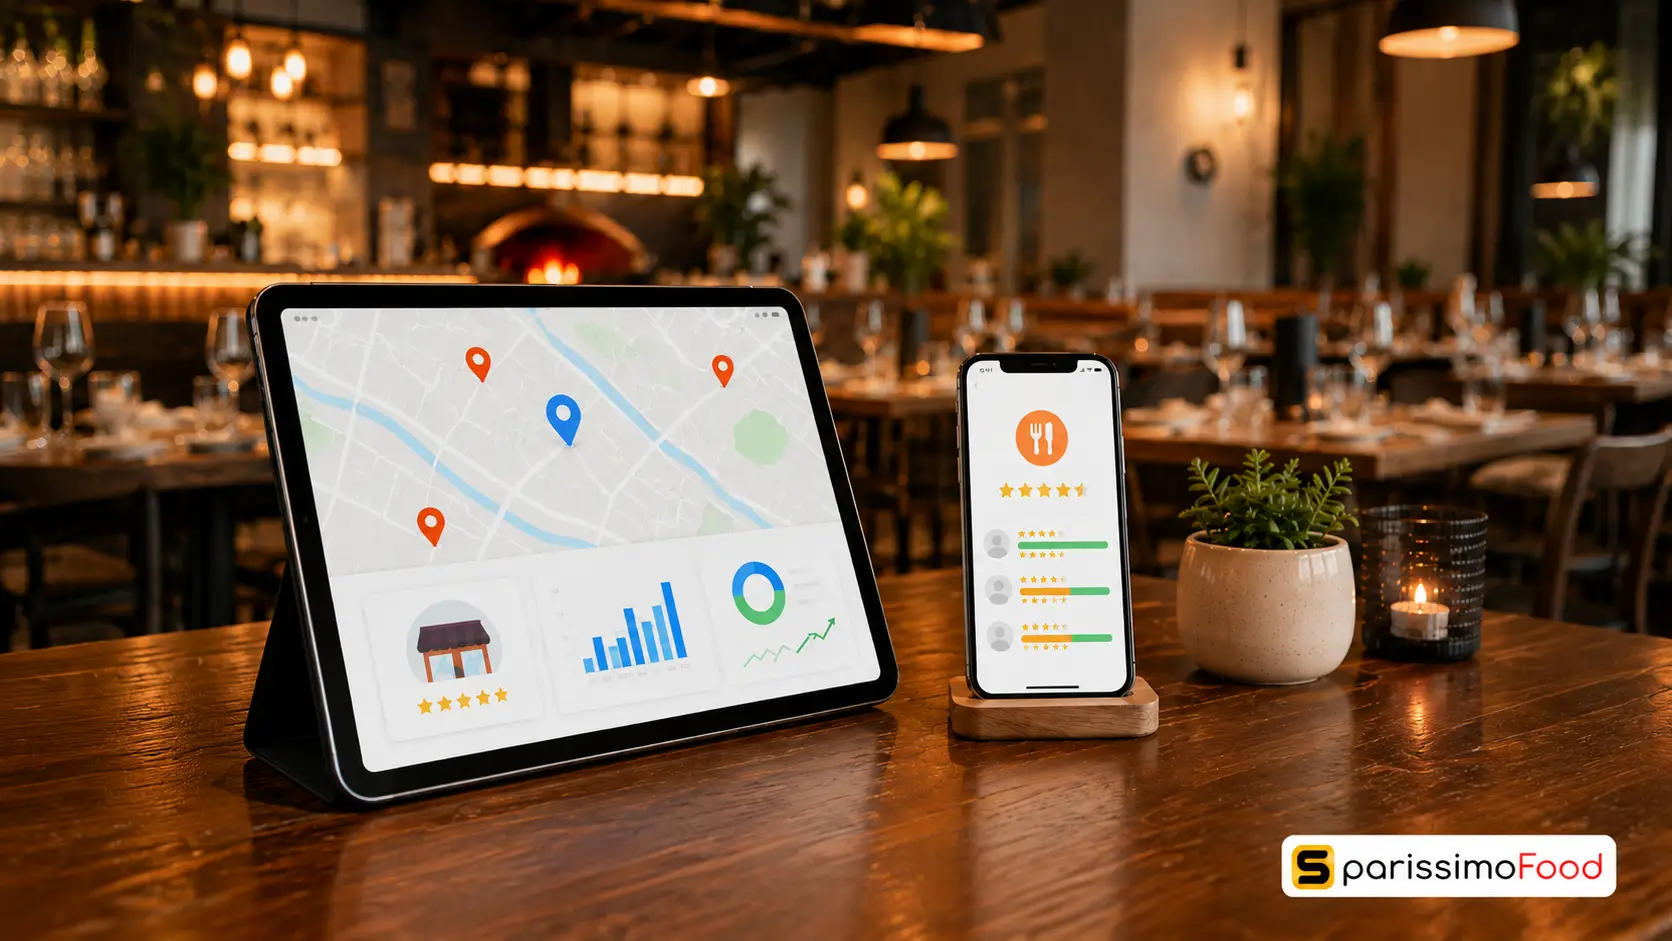
Item-level analytics for the four-quadrant analysis. SparissimoFood’s manager dashboard shows order volume per item over any period you select. This is the sales volume data needed to run the four-quadrant matrix. Combined with your recipe cost data, you can calculate contribution margin per dish and place every item in its correct quadrant. The analysis that once required a spreadsheet and a quarterly review can now be completed in a weekly 15-minute session using your dashboard data.
Photograph upload per item. SparissimoFood’s menu builder supports one photograph per menu item. Adding a photograph to a Puzzle item, the category of dishes with high margin but low order volume, is consistently the highest-impact single change in a quarterly menu review.
QR dine-in ordering as the primary testing environment. Strategic changes tested on your QR dine-in menu produce clean data because every order placed through the system is recorded and attributed to the current menu configuration. If you change the position of an item on Monday and review order data by Thursday, you have four days of real purchasing behaviour showing you whether the change worked.
SparissimoFood starts at CHF 49 per month with an 8% commission on the Starter plan and CHF 79 per month with a 5% commission on the Business plan. Explore the current plan options at manage.sparissimofood.com/plans.
Frequently Asked Questions
What is menu engineering in a restaurant? Menu engineering is the process of analysing every item on a restaurant menu by its contribution margin and its sales volume, then restructuring the menu to direct more orders toward items that generate the highest profit. It uses the four-quadrant Stars, Plowhorses, Puzzles, and Dogs framework to categorise items and guide decisions about placement, photography, pricing, and description. Research from Cornell University’s hospitality program shows that well-executed menu optimisation lifts average order values by 8 to 15% within 90 days of implementation.
What are Stars, Plowhorses, Puzzles, and Dogs on a restaurant menu? Stars are items with high contribution margin and high sales volume. They are your most valuable menu items and should receive the highest visibility. Plowhorses have high sales but low margin and typically need repricing or portion adjustment. Puzzles have strong margin but low sales and need better placement, photographs, or descriptions to increase their order share. Dogs have both low margin and low sales and should typically be removed from the menu. Together, these four categories form the menu engineering matrix that guides every structural menu decision.
How often should I run a menu performance review? For restaurants that have recently completed their first analysis, a monthly review for the first three months produces the fastest learning cycle. After that, quarterly reviews are typically sufficient for stable menus. Restaurants running seasonal menus should complete a full four-quadrant analysis at each seasonal rotation. Restaurants using digital or QR menus have access to real-time item-level order data, which makes a lighter weekly review, typically 10 to 15 minutes, practical and valuable for identifying fast-moving changes in ordering patterns.
Can these principles be applied to online and QR menus? Yes, and digital menus provide significantly more precise optimization data than printed menus. On a digital ordering platform, you can see view rates per item, time spent on each dish, and view-to-order conversion rates alongside the traditional sales volume data. This makes the identification of Puzzles, items that are viewed but not ordered at a high rate, much more accurate. Position changes on a digital menu are also instant and channel-wide, whereas printed menu engineering changes require a full reprint.
What sales improvement can I expect from optimising my menu layout? Research and real-world digital menu data from 2026 consistently show average order value improvements of 8 to 15% within 90 days of a structured quarterly review. The improvement comes primarily from three changes: moving Stars to higher-visibility positions, adding photographs to Puzzles, and removing Dogs that are using category space that could host better-performing items. These changes require no price increases and no additional kitchen investment.
A menu that has been engineered is not a list that has been designed. It is a sales system that has been built.
.Ds4FHhSq_ZxC9WE.webp "Restaurant Upselling Techniques That Don't Feel Pushy")
.CXCr6fQt_Z11gsYh.webp "Build a Branded Restaurant App Without Developers")
.y09Xtv8Z_1gH6f6.webp "Set Up Restaurant Online Ordering in Under a Week")
.B-Rl4IDw_Z204OoN.webp "Restaurant Loss Prevention and Theft Guide")
.DPpk5JZR_AlrVy.webp "Restaurant Communication During Peak Hours | Guide 2026")
.B6eEizW1_Z2bHQYl.webp "Restaurant Menu Pricing Strategies That Actually Protect Your Margins in 2026")
.CRszlDy5_2neUXu.webp "How to Migrate from GloriaFood Without Disruption: A Technical Step-by-Step Guide")
.kT6N2QP-_1Tp2j1.webp "GloriaFood Is Shutting Down on April 30, 2027 — What Every Restaurant Owner Needs to Do Now")